Observability
Logs
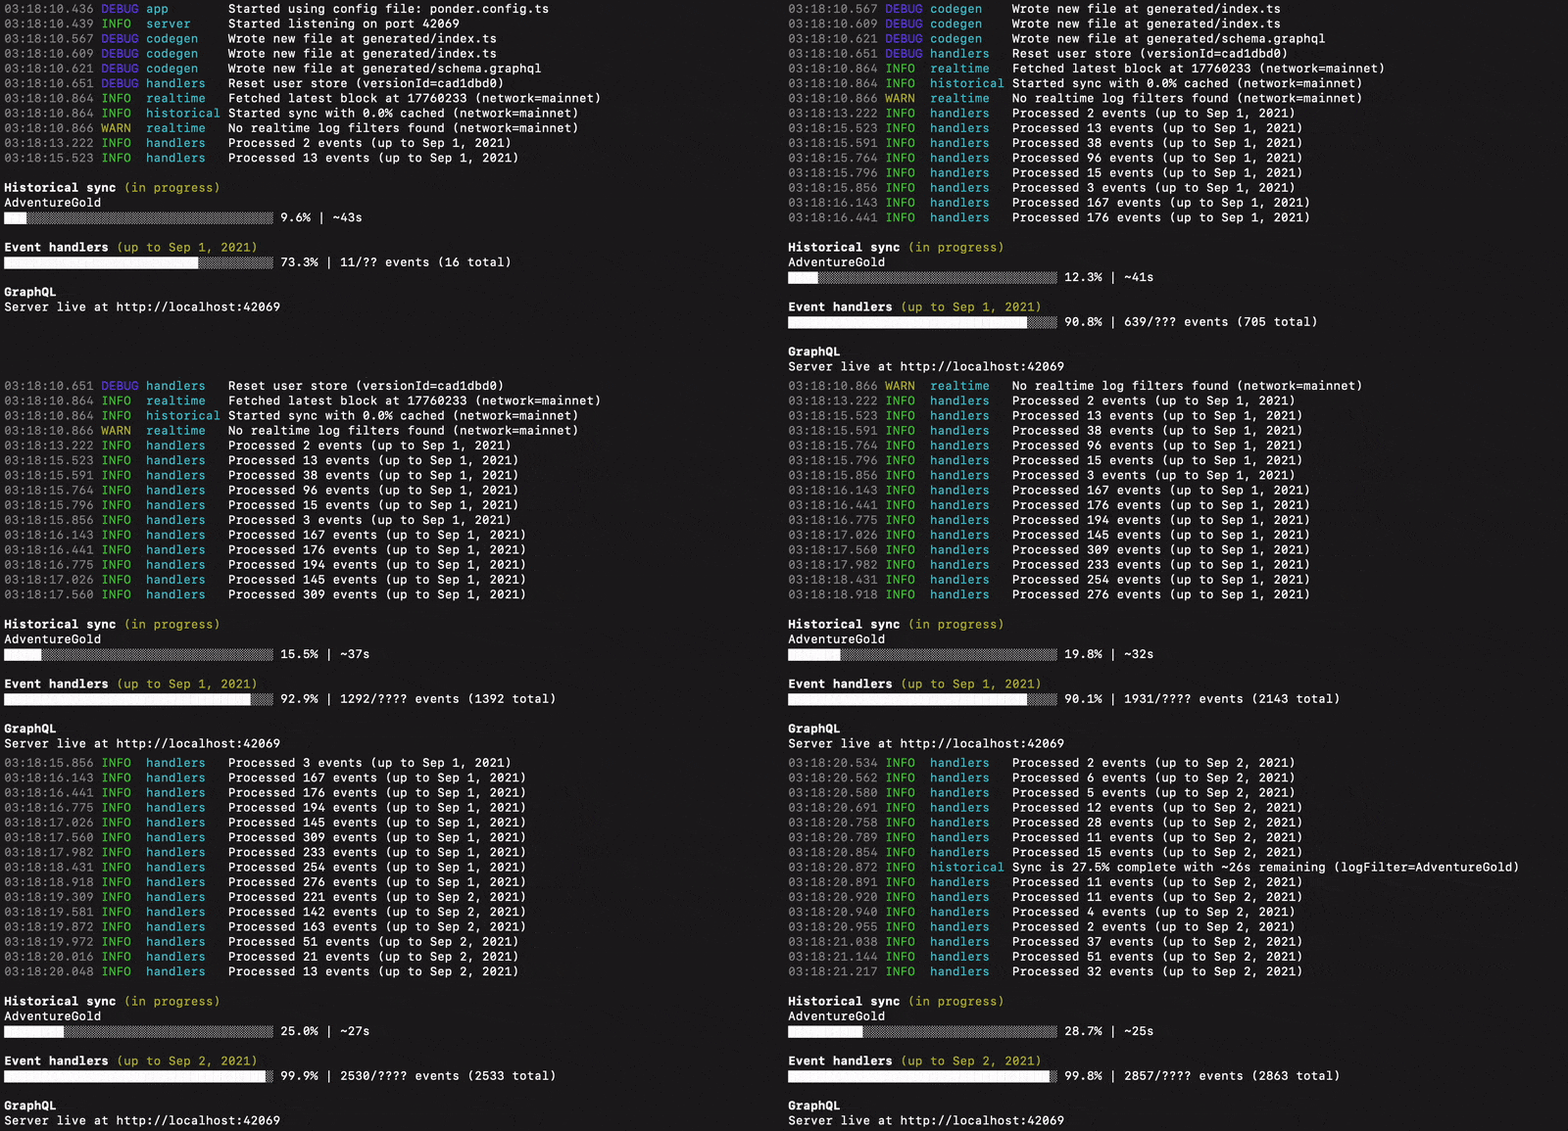
Ponder produces logs to help you understand and debug your application.

Log level
There are two ways to configure the minimum log level. If specified, the environment variable takes precedence over the CLI flag.
- Set the
PONDER_LOG_LEVELenvironment variable - Use the
--log-level <LEVEL>,-v(debug) or-vv(trace) CLI option
PONDER_LOG_LEVEL=traceponder dev --log-level warn
# or, use the shortcut flag for debug
ponder dev -vLevels
| Log level | Example |
|---|---|
silent | |
error | Unrecoverable RPC error, SQL constraint violation |
warn | Reorg reconciliation, malformed config |
info (default) | Indexing progress, real-time block processing |
debug | Internal service lifecycle events |
trace | Query-level database logs |
User logs
Logs produced by your code (e.g. console.log statements in ponder.config.ts or indexing functions) will always be written to the console. Note that Ponder does catch errors thrown by your code and emits an error log including the original error message and stack trace.
Log format
Use the --log-format <FORMAT> CLI option to set the log format.
Pretty (default)
ponder start --log-format pretty11:54:36 AM INFO build Using PGlite database at .ponder/pglite (default)
11:54:36 AM INFO database Created table 'Account' in 'public.db'
11:54:36 AM INFO server Started listening on port 42069
11:54:36 AM INFO historical Started syncing 'optimism' logs for 'weth9' with 0.0% cached
11:54:36 AM INFO historical Started syncing 'base' logs for 'weth9' with 0.0% cached
11:54:36 AM INFO historical Started syncing 'polygon' logs for 'weth9' with 0.0% cachedJSON
ponder start --log-format jsonThe JSON log format emits newline-delimited JSON objects with properties level, time, service, msg, and (optionally) error.
{"level":30,"time":1717170664426,"service":"build","msg":"Using PGlite database at .ponder/pglite (default)"}
{"level":30,"time":1717170664454,"service":"database","msg":"Created table 'Account' in 'public.db'"}
{"level":30,"time":1717170664458,"service":"server","msg":"Started listening on port 42069"}
{"level":30,"time":1717170664625,"service":"historical","msg":"Started syncing 'base' logs for 'weth9' with 0.0% cached"}
{"level":30,"time":1717170664628,"service":"historical","msg":"Started syncing 'optimism' logs for 'weth9' with 0.0% cached"}
{"level":30,"time":1717170664683,"service":"historical","msg":"Started syncing 'polygon' logs for 'weth9' with 0.0% cached"}Metrics
Ponder apps publish Prometheus metrics at the /metrics path.
| name | description | type |
|---|---|---|
| ponder_indexing_total_seconds | Total number of seconds required for indexing | gauge |
| ponder_indexing_completed_seconds | Number of seconds that have been completed | gauge |
| ponder_indexing_completed_events | Number of events that have been processed | gauge |
| ponder_indexing_completed_timestamp | Timestamp through which all events have been completed | gauge |
| ponder_indexing_has_error | Boolean (0 or 1) indicating if there is an indexing error | gauge |
| ponder_indexing_function_duration | Duration of indexing function execution | histogram |
| ponder_indexing_function_error_total | Total number of errors encountered during indexing function execution | counter |
| ponder_historical_start_timestamp | Unix timestamp (ms) when the historical sync service started | gauge |
| ponder_historical_total_blocks | Number of blocks required for the historical sync | gauge |
| ponder_historical_cached_blocks | Number of blocks that were found in the cache for the historical sync | gauge |
| ponder_historical_completed_blocks | Number of blocks that have been processed for the historical sync | gauge |
| ponder_realtime_is_connected | Boolean (0 or 1) indicating if the realtime sync service is connected | gauge |
| ponder_realtime_latest_block_number | Block number of the latest synced block | gauge |
| ponder_realtime_latest_block_timestamp | Block timestamp of the latest synced block | gauge |
| ponder_realtime_reorg_total | Count of how many re-orgs have occurred | counter |
| ponder_database_method_duration | Duration of database operations | histogram |
| ponder_database_method_error_total | Total number of errors encountered during database operations | counter |
| ponder_http_server_port | Port that the server is listening on | gauge |
| ponder_http_server_active_requests | Number of active HTTP server requests | gauge |
| ponder_http_server_request_duration_ms | Duration of HTTP responses served by the server | histogram |
| ponder_http_server_request_size_bytes | Size of HTTP requests received by the server | histogram |
| ponder_http_server_response_size_bytes | Size of HTTP responses served by the server | histogram |
| ponder_rpc_request_duration | Duration of RPC requests | histogram |
| ponder_rpc_request_lag | Time RPC requests spend waiting in the request queue | histogram |
| ponder_postgres_pool_connections | Gauge of current connections for PostgreSQL pools | gauge |
| ponder_postgres_query_queue_size | Current size of the query queue for PostgreSQL | gauge |
| ponder_postgres_query_total | Total number of queries processed by PostgreSQL | counter |
Indexing status
To check the indexing status of your app, use the /status endpoint or the _meta field in the GraphQL API.
Usage
Use the indexing status to quickly confirm that Ponder is working as expected. You can also poll the status to confirm that a specific block number has been ingested by Ponder before refetching a query client-side (for example, in a form submit handler).
HTTP
curl http://localhost:42069/status{
"mainnet": {
"ready": true,
"block": {
"number": 20293450,
"timestamp": 1720823759
}
},
"base": {
"ready": true,
"block": {
"number": 17017206,
"timestamp": 1720823759
}
}
}GraphQL
query {
_meta {
status
}
}{
"_meta": {
"status": {
"mainnet": {
"ready": true,
"block": {
"number": 20293464,
"timestamp": 1720823939
}
},
"base": {
"ready": false,
"block": null
}
}
}
}API
The response object contains a property for each network in your app with the following fields.
| field | type | description |
|---|---|---|
| ready | boolean | true if historical indexing is complete. |
| block | { number: number; timestamp: number; } | null | The most recently indexed block, or null if historical indexing is not complete. |